Butler County
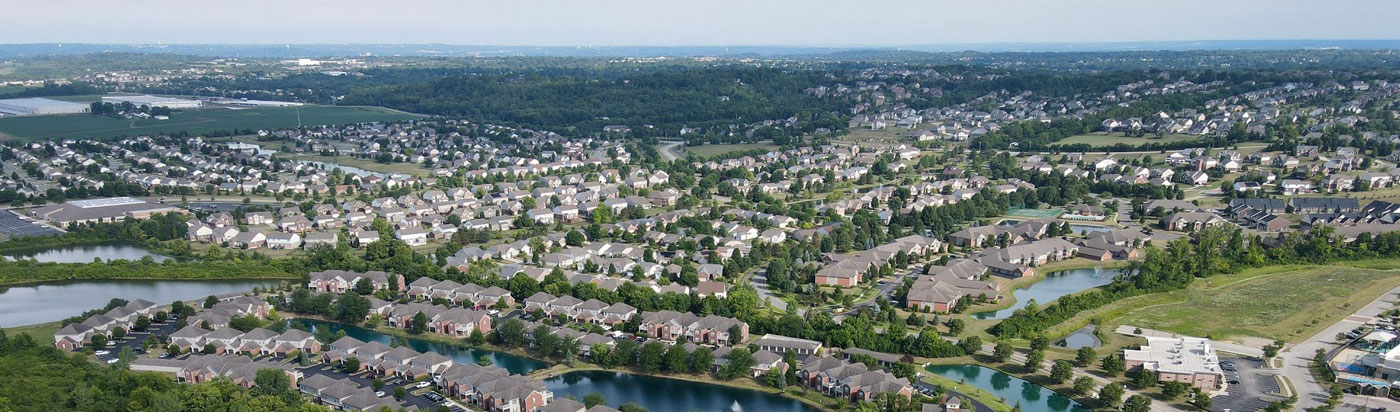
Butler County is a vibrant and growing community. Life in Butler County is not just about business; it's a community that embraces its residents with open arms in both the business sector and daily life.
Butler County is strategically located between Cincinnati and Dayton, offering rich resources and world-class infrastructure. This prime location, combined with a skilled workforce and a pro-business climate, makes Butler County ideal for business.
The local economy has rapidly diversified, attracting new businesses to the community. Today, Butler County is a hub for product distribution for national and international companies beyond the traditional industries.
As a result, Butler County continues to grow, with the population forecasted to exceed 450,000 by 2040. Employment is projected to grow at an annual rate of 1.5%, creating over 30,000 new jobs. Real personal income and retail sales are projected to increase by 3.5% and 4% per year, respectively. This growth rate aligns with Ohio's overall economic expansion, making Butler County a leading area for business and community development.
Butler County Fast Facts
- Located between Cincinnati and Dayton, Butler County businesses draw on the labor force from both MSAs.
- Population: 388,420
- Jobs: 169,549
- GDP: $22,289,285,304
Population
Population
| Population | 2000 | 2010 | 2025 | 2030 |
|---|---|---|---|---|
| Butler County | 332,786 | 368,130 | 396,087 | 399,762 |
Source: ESRI, 2025-08-18
Population by Age
| Population | 2025 |
|---|---|
| 0-4 | 22,581 |
| 5-9 | 24,201 |
| 10-14 | 24,946 |
| 15-19 | 30,259 |
| 20-24 | 31,329 |
| 25-29 | 24,234 |
| 30-34 | 24,152 |
| 35-39 | 25,034 |
| 40-44 | 25,520 |
| 45-49 | 23,135 |
| 50-54 | 23,328 |
| 55-59 | 23,203 |
| 60-64 | 24,532 |
| 65-69 | 23,090 |
| 70-74 | 17,969 |
| 75-79 | 13,526 |
| 80-84 | 8,073 |
| 85+ | 6,975 |
| 18+ | 309,072 |
| Median Age | 38 |
Source: ESRI, 2025-08-18
Population by Race
| Butler County | 2025 |
|---|---|
| Total | 396,087.00 |
| White Alone | 73.78% |
| Black Alone | 9.72% |
| American Indian Alone | 0.4% |
| Asian Alone | 5.11% |
| Pacific Islander Alone | 0.17% |
| Some Other Race | 3.77% |
| Two or More Races | 7.04% |
| Hispanic Origin | 7.15% |
| Diversity Index | 51.20 |
Source: ESRI, 2025-08-18
Growth Rate
| Butler County | 2025 - 2030 |
|---|---|
| Population | 0.18% |
| Households | 0.31% |
| Families | 0.09% |
| Median Household Income | 3% |
| Per Capita Income | 2% |
Source: ESRI, 2025-08-18
Housing
Households
| Population | 2000 | 2010 | 2025 | 2030 |
|---|---|---|---|---|
| Households | 123,073 | 135,960 | 149,054 | 151,405 |
| Housing Units | 129,784 | 148,273 | 157,108 | 159,302 |
| Owner Occupied Units | 101,630 | 103,988 | ||
| Renter Occupied Units | 47,424 | 47,417 | ||
| Vacant Units | 8,054 | 7,897 |
Source: ESRI, 2025-08-18
Home Value
| Butler County | 2025 | 2030 |
|---|---|---|
| Median Home Value | $304,575 | $356,409 |
| Average Home Value | $332,983 | $391,760 |
| <$50,000 | 3,220 | 2,075 |
| $50,000 - $99,999 | 5,206 | 2,443 |
| $100,000 - $149,999 | 7,408 | 3,602 |
| $150,000 - $199,999 | 10,427 | 6,552 |
| $200,000 - $249,999 | 11,274 | 8,805 |
| $250,000 - $299,999 | 12,093 | 11,352 |
| $300,000 - $399,999 | 25,630 | 30,403 |
| $400,000 - $499,999 | 14,438 | 20,679 |
| $500,000 - $749,999 | 8,819 | 13,562 |
| $1,000,000 + | 1,278 | 2,020 |
Source: ESRI, 2025-08-18
Housing Year Built
| Year Range | Houses Built |
|---|---|
| 2010 or Later | 10,389 |
| 2000-2009 | 21,982 |
| 1990-1999 | 22,859 |
| 1980-1989 | 18,349 |
| 1970-1979 | 25,797 |
| 1960-1969 | 13,776 |
| 1950-1959 | 17,563 |
| 1940-1949 | 5,713 |
| 1939 or Before | 17,363 |
Source: ESRI, 2025-08-18
Back To TopIncome
Income
| Butler County | 2025 | 2030 |
|---|---|---|
| Median Household | $84,689 | $97,034 |
| Average Household | $107,725 | $119,965 |
| Per Capita | $40,671 | $45,567 |
Source: ESRI, 2025-08-18
Household Income
| Butler County | 2025 |
|---|---|
| <$15,000 | 11,828 |
| $15,000 - $24,999 | 8,311 |
| $25,000 - $34,999 | 10,495 |
| $35,000 - $49,999 | 15,548 |
| $50,000 - $74,999 | 19,834 |
| $75,000 - $99,999 | 18,757 |
| $100,000 - $149,999 | 31,394 |
| $150,000 - $199,999 | 16,503 |
| $200,000+ | 16,384 |
Source: ESRI, 2025-08-18
Back To TopEmployees
Commute
| Category | Commuters |
|---|---|
| Workers 16+ | 183,302 |
| In-County Residents | 110,819 |
| Out-of-County Residents | 69,322 |
| Drive Alone | 140,630 |
| Carpooled | 15,119 |
| Public Transport | 625 |
| Work at Home | 21,674 |
| Motorcycle | 248 |
| Bicycle | 554 |
| Walked | 3,209 |
| Other | 1,178 |
| Less than 5 minutes | 3,525 |
| 5-9 minutes | 14,140 |
| 10-14 minutes | 21,035 |
| 15-19 minutes | 25,222 |
| 20-24 minutes | 27,411 |
| 25-29 minutes | 13,303 |
| 30-34 minutes | 21,966 |
| 35-39 minutes | 8,022 |
| 40-44 minutes | 7,094 |
| 45-59 minutes | 12,697 |
| 60-89 minutes | 4,706 |
| 90+ minutes | 2,507 |
| Average Travel Time | 25 |
Source: ESRI, 2025-08-18
Source: ESRI, 2025-08-18
Employees by NAICS
| Category | Number |
|---|---|
| Total Employees | 161,188 |
| Agr/Forestry/Fish/Hunt | 206 |
| Mining | 181 |
| Utilities | 360 |
| Construction | 8,601 |
| Manufacturing | 17,506 |
| Wholesale Trade | 7,717 |
| Retail Trade | 23,315 |
| Motor Veh/Parts Dealers | 3,289 |
| Furn & Home Furnish Str | 2,069 |
| Electronics & Appl Store | 420 |
| Bldg Matl/Garden Equip | 2,817 |
| Food & Beverage Stores | 4,135 |
| Health/Pers Care Stores | 3,163 |
| Gasoline Stations | 403 |
| Clothing/Accessory Store | 1,230 |
| Sports/Hobby/Book/Music | 1,644 |
| General Merchandise Str | 4,145 |
| Transportation/Warehouse | 5,265 |
| Information | 1,901 |
| Finance & Insurance | 7,176 |
| Cntrl Bank/Crdt Intrmdtn | 1,641 |
| Sec/Cmdty Cntrct/Oth Inv | 645 |
| Insur/Funds/Trusts/Other | 4,890 |
| Real Estate/Rent/Leasing | 3,530 |
| Prof/Scientific/Tech Srv | 9,011 |
| Legal Services | 1,135 |
| Mgmt of Comp/Enterprises | 181 |
| Admin/Support/Waste Mgmt | 4,498 |
| Educational Services | 11,576 |
| HealthCare/Social Assist | 24,176 |
| Arts/Entertainment/Rec | 2,830 |
| Accommodation/Food Srvcs | 16,172 |
| Accommodation | 1,109 |
| Food Srv/Drinking Places | 15,063 |
| Other Srv excl Pub Admin | 8,321 |
| Auto Repair/Maintenance | 1,395 |
| Public Administration Emp | 8,590 |
Source: ESRI, 2025-08-18
Educational Attainment (25+)
| Butler County | 2025 |
|---|---|
| <9th Grade | 6,969 |
| Some High School | 13,629 |
| GED | 9,332 |
| Graduated High School | 74,390 |
| Some College/No Degree | 43,081 |
| Associates Degree | 24,779 |
| Bachelor's Degree | 57,196 |
| Graduate Degree | 33,395 |
Source: ESRI, 2025-08-18
Back To TopBusinesses
Businesses by NAICS
| Category | Number |
|---|---|
| Total Businesses | 12,011 |
| Agr/Forestry/Fish/Hunt Bus | 52 |
| Mining Bus | 14 |
| Utilities Bus | 12 |
| Construction Bus | 997 |
| Manufacturing Bus | 632 |
| Wholesale Trade Bus | 488 |
| Retail Trade Bus | 1,540 |
| Motor Veh/Parts Dealers Bus | 236 |
| Furn & Home Furnish Str Bus | 85 |
| Electronics & Appl Store Bus | 49 |
| Bldg Matl/Garden Equip Bus | 136 |
| Food & Beverage Stores Bus | 217 |
| Health/Pers Care Stores Bus | 170 |
| Gasoline Stations Bus | 81 |
| Clothing/Accessory Store Bus | 143 |
| Sports/Hobby/Book/Music Bus | 253 |
| General Merchandise Str Bus | 170 |
| Transportation/Warehouse Bus | 296 |
| Information Bus | 197 |
| Finance & Insurance Bus | 563 |
| Cntrl Bank/Crdt Intrmdtn Bus | 243 |
| Sec/Cmdty Cntrct/Oth Inv Bus | 145 |
| Insur/Funds/Trusts/Other Bus | 175 |
| Real Estate/Rent/Leasing Bus | 517 |
| Prof/Scientific/Tech Srv Bus | 970 |
| Legal Services Bus | 170 |
| Mgmt of Comp/Enterprises Bus | 20 |
| Admin/Support/Waste Mgmt Bus | 433 |
| Educational Services Bus | 334 |
| HealthCare/Social Assist Bus | 1,165 |
| Arts/Entertainment/Rec Bus | 268 |
| Accommodation/Food Srvcs Bus | 955 |
| Accommodation Bus | 64 |
| Food Srv/Drinking Places Bus | 891 |
| Other Srv excl Pub Admin Bus | 1,749 |
| Auto Repair/Maintenance Bus | 309 |
| Public Administration Bus | 329 |
Source: ESRI, 2025-08-18
Back To Top